Complex Example Implementation
The following network utilizes the Homeostasis, the Normalization and the STDP behaviour from the current section.
from PymoNNto import *
from Examples_Paper.STDP_Hom_Norm.Normalization import *
from Examples_Paper.STDP_Hom_Norm.STDP import *
from Examples_Paper.STDP_Hom_Norm.Homeostasis import *
class Basic_Behaviour(Behaviour):
def set_variables(self, neurons):
neurons.voltage = neurons.get_neuron_vec()
self.threshold = 0.5
def new_iteration(self, neurons):
firing = neurons.voltage > self.threshold
neurons.spike = firing.astype(def_dtype) #spikes
neurons.voltage[firing] = 0.0#reset
neurons.voltage *= 0.9 #voltage decay
neurons.voltage += neurons.get_neuron_vec('uniform', density=0.01) #noise
class Input_Behaviour(Behaviour):
def set_variables(self, neurons):
for synapse in neurons.afferent_synapses['GLUTAMATE']:
synapse.W = synapse.get_synapse_mat('uniform',density=0.1)
synapse.enabled = synapse.W > 0
def new_iteration(self, neurons):
for synapse in neurons.afferent_synapses['GLUTAMATE']:
neurons.voltage += synapse.W.dot(synapse.src.spike)/synapse.src.size*10
My_Network = Network()
My_Neurons = NeuronGroup(net=My_Network, tag='my_neurons', size=get_squared_dim(100), behaviour={
1: Basic_Behaviour(),
2: Input_Behaviour(),
3: Homeostasis(target_voltage=0.05),
4: STDP(stdp_factor=0.00015),
5: Normalization(norm_factor=10),
9: Recorder(tag='my_recorder', variables=['n.voltage', 'np.mean(n.voltage)']),
10: EventRecorder(tag='my_event_recorder', variables=['n.spike'])
})
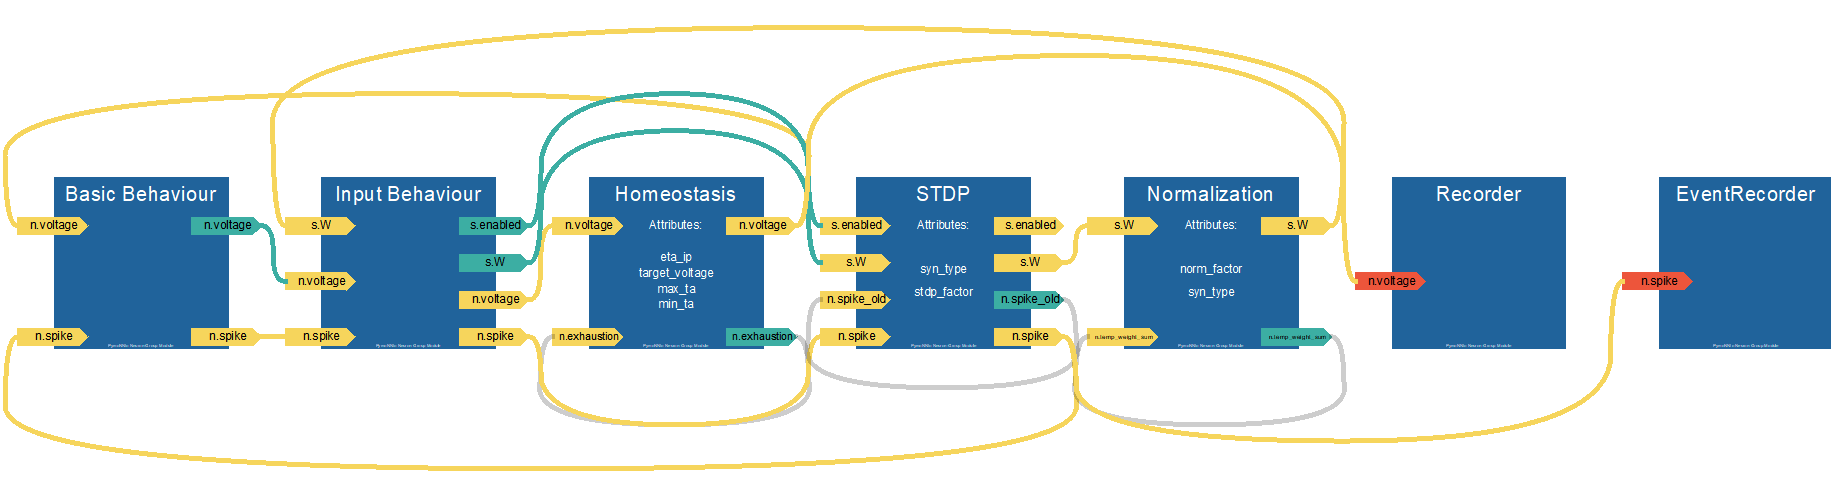
My_Neurons.visualize_module()#, only_feed_forward_connections=True
my_syn = SynapseGroup(net=My_Network, src=My_Neurons, dst=My_Neurons, tag='GLUTAMATE')
My_Network.initialize()
My_Network.simulate_iterations(200)
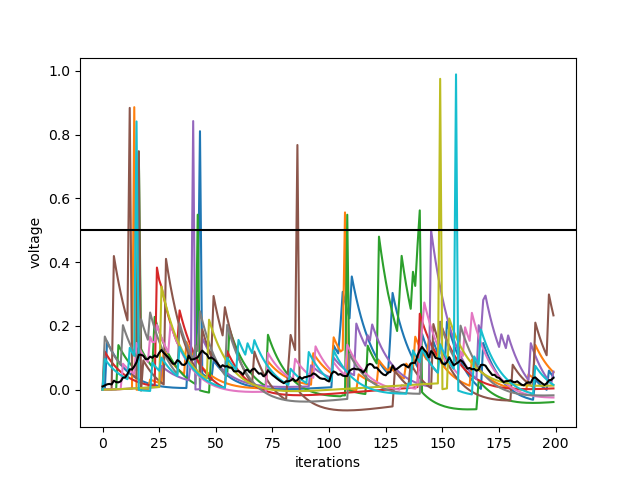
import matplotlib.pyplot as plt
plt.plot(My_Network['n.voltage', 0, 'np'][:,0:10])
plt.plot(My_Network['np.mean(n.voltage)', 0], color='black')
plt.axhline(My_Neurons['Basic_Behaviour', 0].threshold, color='black')
plt.xlabel('iterations')
plt.ylabel('voltage')
plt.show()
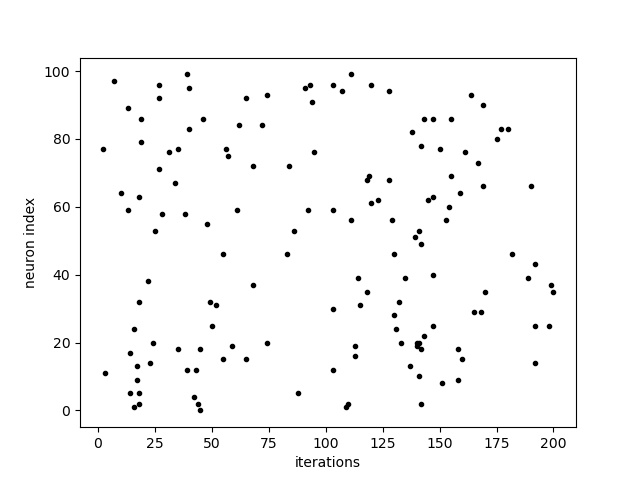
plt.plot(My_Network['n.spike.t', 0], My_Network['n.spike.i', 0], '.k')
plt.xlabel('iterations')
plt.ylabel('neuron index')
plt.show()
plt.scatter(My_Neurons.x, My_Neurons.y)
plt.xlabel('x position')
plt.ylabel('y position')
plt.show()
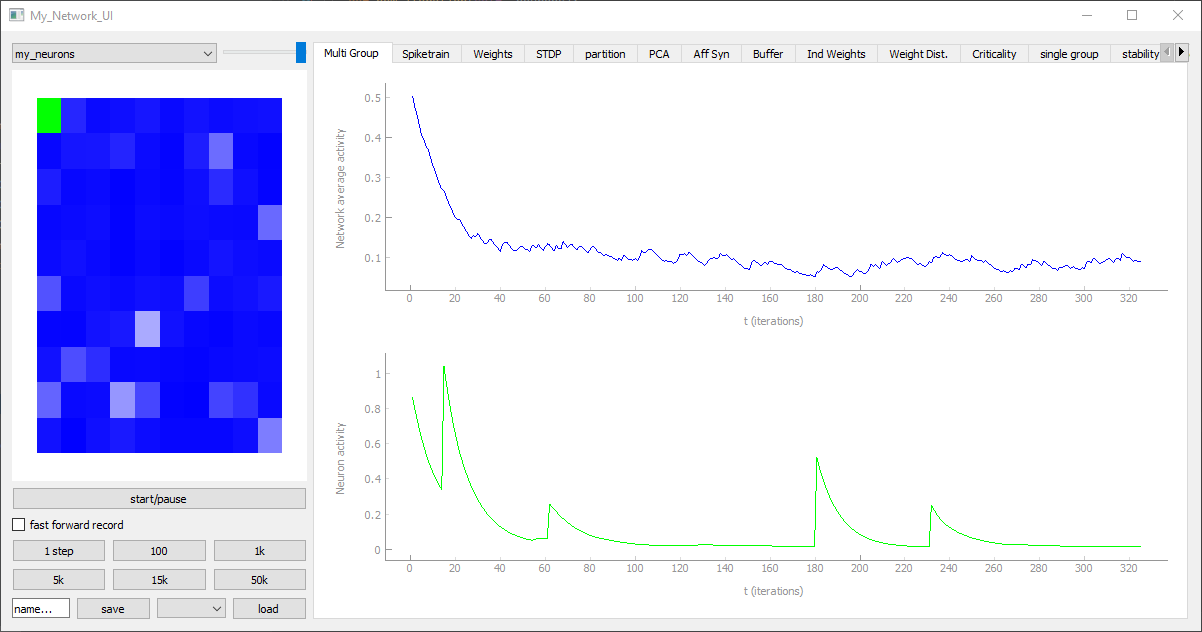
from PymoNNto.Exploration.Network_UI import *
from Examples_Paper.Basic.Basic_Tab import *
my_UI_modules = [MyUITab()] + get_default_UI_modules(['spike', 'voltage'], ['W'])#, 'exhaustion'
Network_UI(My_Network, modules=my_UI_modules, label='My_Network_UI', group_display_count=1).show()