Basic Tab
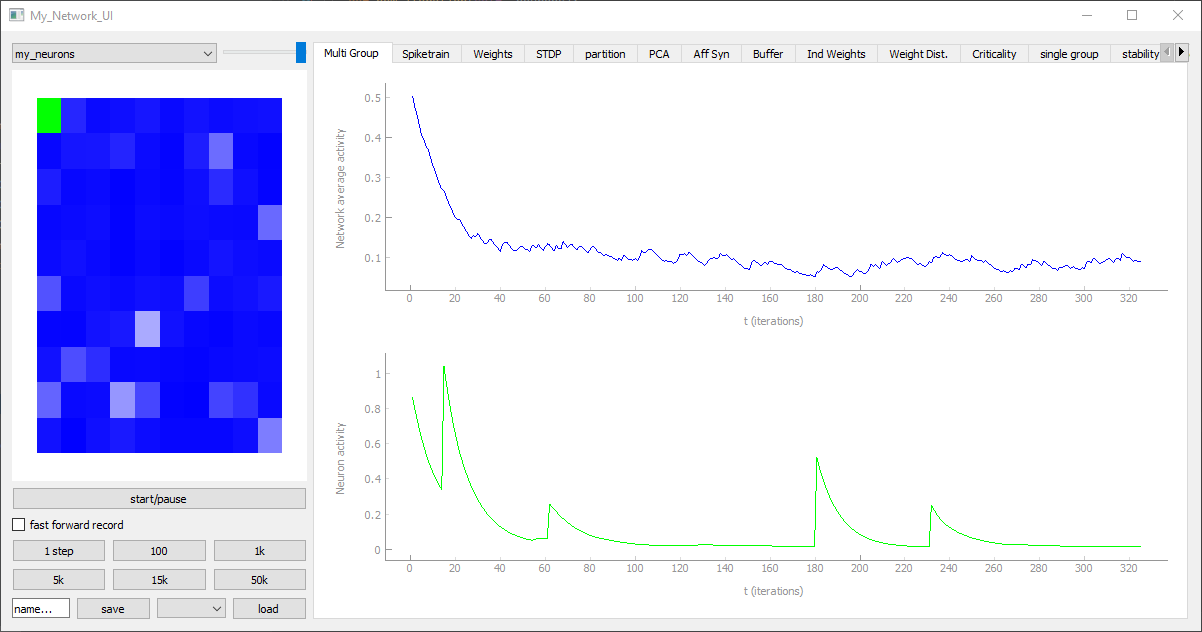
Here we see the source code of a very minimalistic tab which is able to display two plots which show the mean voltage of the NeuronGroup and the voltage of the selected neuron over time.
from PymoNNto.Exploration.Network_UI.TabBase import *

class MyUITab(TabBase):

    def __init__(self, title='myTab'):
        super().__init__(title)

    def add_recorder_variables(self, net_obj, Network_UI):
        #if hasattr(net_obj, 'activity'):
        Network_UI.add_recording_variable(net_obj, 'np.mean(n.voltage)', timesteps=1000)

    def initialize(self, Network_UI):
        self.my_Tab = Network_UI.Next_Tab(self.title)
        self.my_curve = Network_UI.Add_plot_curve(x_label='t', y_label='mean voltage')

    def update(self, Network_UI):
        if self.my_Tab.isVisible():
            data = Network_UI.network['np.mean(n.voltage)', 0, 'np'][-1000:]
            iterations = Network_UI.network['n.iteration', 0, 'np'][-1000:]
            self.my_curve.setData(iterations, data)

        #...
#ui_modules = [MyUITab()] + get_default_UI_modules()
#Network_UI(my_network, modules=ui_modules, ...).show()