User Interface
To control and evaluate the model from the "Basics" section with PymoNNto's interactive graphical user interface we can replace the pyplot functions, the recorder and the simulate_iterations with code to launch the Network_UI.
Like other parts of PymoNNto, the Network_UI is modular. It consists of multiple UI_modules, which we can be freely chosen. Here, we use the function get_default_UI_modules to get a list of standard modules applicable to most networks.
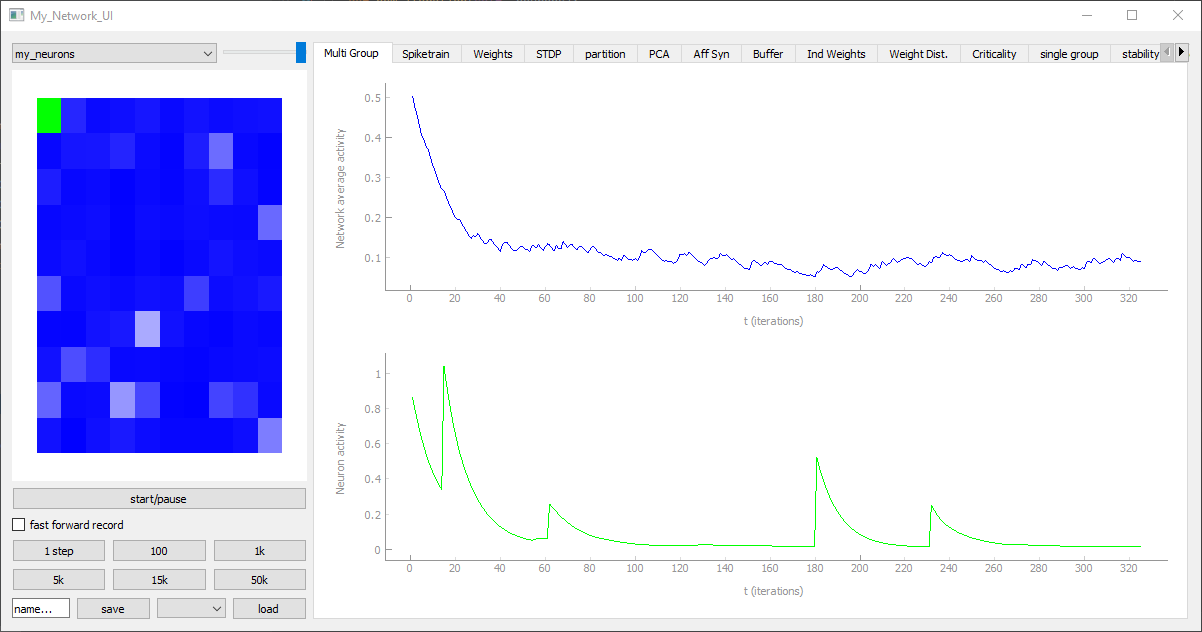
get_default_UI_modules receives a list of neuron variable names as well as a list of all the synapse variable names we want to display. The first neuron variable in the list will be used to set the brightness of the network activity grid module (blue rectangle on image)
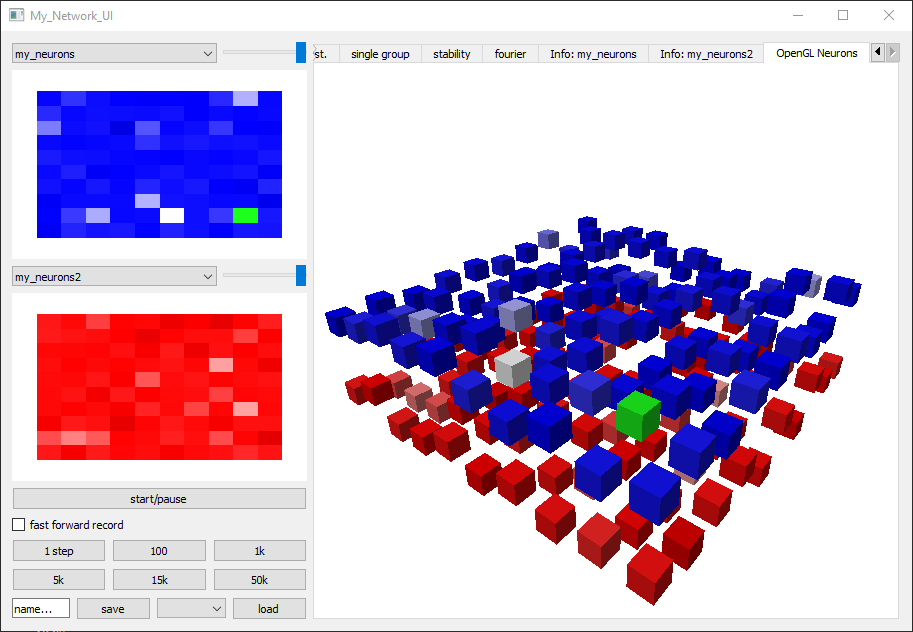
Network_UI is initialized with the Network object, the ui module list, the window title. Additional to this, the attribute group_display_count defines how much activity grid modules we want to display, in case we want to see multiple NeuronGroups at once. The base color of the grid module can be defined by setting the MyNeuronGroup.color=(r,g,b,alpha) variable.
We can also set group_tags=[] and transmitters=[] (lists of strings) manually if we only want to display groups with certain tags or transmitters.
If we set reduced_layout to True we can remove the axis labels of the plots, so we get bigger plotting areas and a cleaner look.
To correctly render the output, some UI_modules require additional specifications or adjustment of the code. In this example, the sidebar_activity_module, displays the activity of the neurons on a grid and allows to select individual neurons. The size of the grid is specified as a property of the neuron group via a NeuronDimension module (here replaced with get_squared_dim(100) to get a 10x10 grid), which creates spatial coordinates for each neuron stored in the vectors x, y and z.
from PymoNNto import *


class Basic_Behavior(Behavior):

    def initialize(self, neurons):
        neurons.voltage = neurons.vector()
        self.leak_factor = 0.9
        self.threshold = 0.5

    def iteration(self, neurons):
        firing = neurons.voltage > self.threshold
        neurons.spike = firing.astype(neurons.def_dtype)  # spikes
        neurons.voltage[firing] = 0.0  # reset

        neurons.voltage *= self.leak_factor  # voltage decay
        neurons.voltage += neurons.vector('uniform', density=0.01)  # noise


class Input_Behavior(Behavior):

    def initialize(self, neurons):
        for synapse in neurons.synapses(afferent, 'GLUTAMATE'):
            synapse.W = synapse.matrix('uniform', density=0.1)
            synapse.enabled = synapse.W > 0

    def iteration(self, neurons):
        for synapse in neurons.synapses(afferent, 'GLUTAMATE'):
            neurons.voltage += synapse.W.dot(synapse.src.spike) / synapse.src.size * 10


My_Network = Network()

My_Neurons = NeuronGroup(net=My_Network, tag='my_neurons', size=get_squared_dim(100), behavior={
    1: Basic_Behavior(),
    2: Input_Behavior()
})

My_Neurons.visualize_module()

my_syn = SynapseGroup(net=My_Network, src=My_Neurons, dst=My_Neurons, tag='GLUTAMATE')

My_Network.initialize()

My_Network.simulate_iterations(1000, measure_block_time=True)

from PymoNNto.Exploration.Network_UI import *

my_UI_modules = get_default_UI_modules(['voltage', 'spike'], ['W'])
Network_UI(My_Network, modules=my_UI_modules, label='My_Network_UI', group_display_count=1).show()
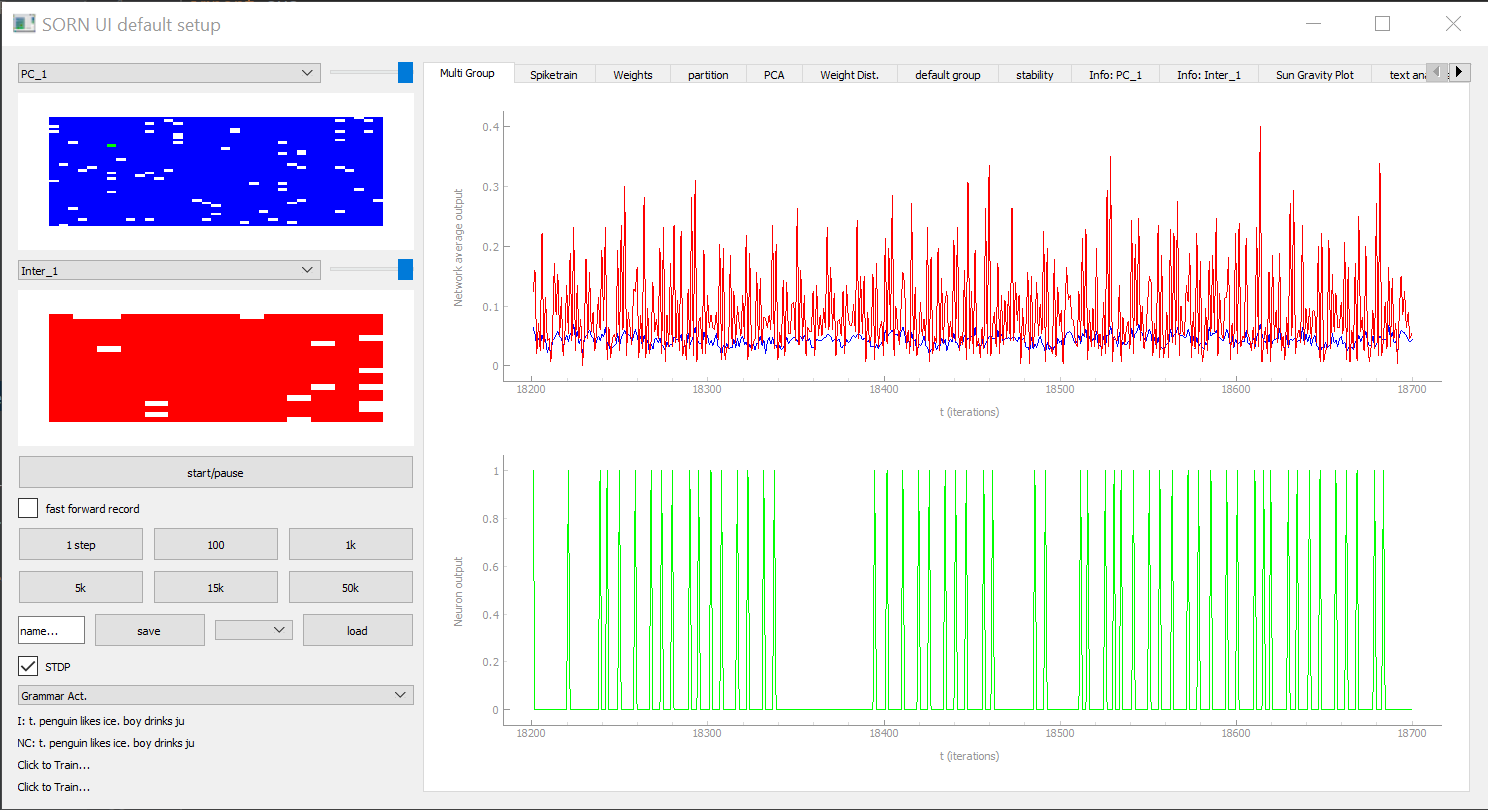
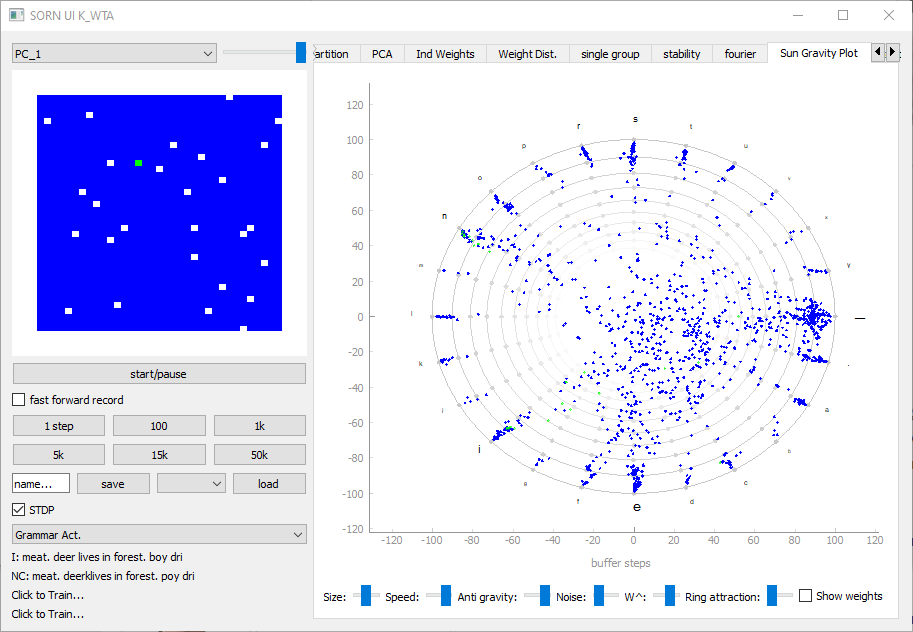
There is a huge variety of useful UI Tabs. Examples can be seen here: