Basic Code Structure
The following code creates a network of 100 neurons with recurrent connections and simulates them for 1000 iterations. What is still missing are some behavior modules. This modules have to be passed to the NeuronGrop to definde what the neurons are supposed to do at each timestep.
from PymoNNto import *
My_Network = Network()
NeuronGroup(net=My_Network, tag='my_neurons', size=100)
SynapseGroup(net=My_Network, src='my_neurons', dst='my_neurons', tag='GLUTAMATE')
My_Network.initialize()
My_Network.simulate_iterations(1000)
Behavior
Each Behavior Module has the following layout where initialize is called when the Network is initialized, while
iteration is called repeatedly every timestep. neurons points to the parent neuron group the behavior belongs to or some other parent object the beaviour is attached to.
In this example we define a variable voltage and a threshold. The activity-vector is initialized with 0 values for each neuron.
At each timestep a spike is created if the voltage is above the threshold value. After that, the voltage vector is decreased with factor 0.9 and random input is added.
When we combine the previous code blocks we can add the Basic_Behavior to the NeuronGroup.
The number in front of each behavior (1 and 9) have to be positive and determine the order of execution for each module inside and accross NeuronGroups.
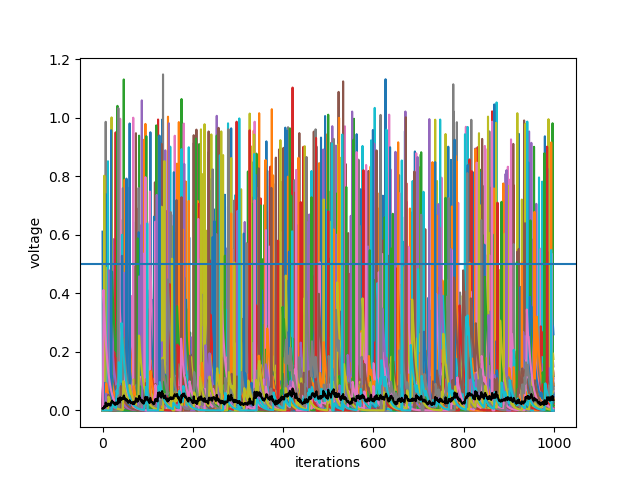
To plot the neurons activity over time, we also have to create a Recorder. Here the voltage and the mean-voltage are stored at each timestep.
At the end the data is plotted via the tagging system (see tagging system section).
class Basic_Behavior(Behavior):

    def initialize(self, neurons):
        neurons.voltage = neurons.vector()
        self.threshold = 0.5

    def iteration(self, neurons):
        neurons.spike = neurons.voltage > self.threshold
        neurons.voltage[neurons.spike] = 0.0 #reset

        neurons.voltage *= 0.9 #voltage decay
        neurons.voltage += neurons.vector('uniform',density=0.01) #noise

...

# Add behavior to NeuronGroup
NeuronGroup(net=My_Network, tag='my_neurons', size=100, behavior={
    1: Basic_Behavior(),
    9: Recorder(['voltage', 'np.mean(voltage)'], tag='my_recorder')
})

...

import matplotlib.pyplot as plt
plt.plot(My_Network['n.voltage', 0, 'np'][:,0:10])
plt.plot(My_Network['np.mean(n.voltage)', 0], color='black')
plt.axhline(My_Network.my_neurons.Basic_Behavior.threshold, color='black')
plt.show()
Synapses and Input
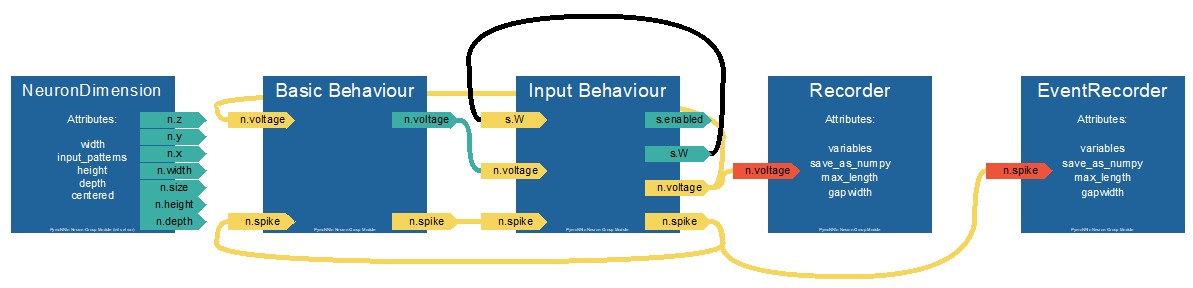
We can add more behavior modues to make the activity of the neurons more complex. Here the module Input_Behavior is added.
In initialize the synapse matrix is created, which stores one weight-value from each neuron to each neuron.
The Function iteration defines how the information is propagated to each neuron (dot product) and adds some term for random input.
The for loops are not neccessary here, because we only have one SynapseGroup.
This solution, however, also works with multiple Neuron- and SynapseGroups.
With synapse.src and synapse.dst you can access the source and destination NeuronGroups assigned to a SynapseGroup.
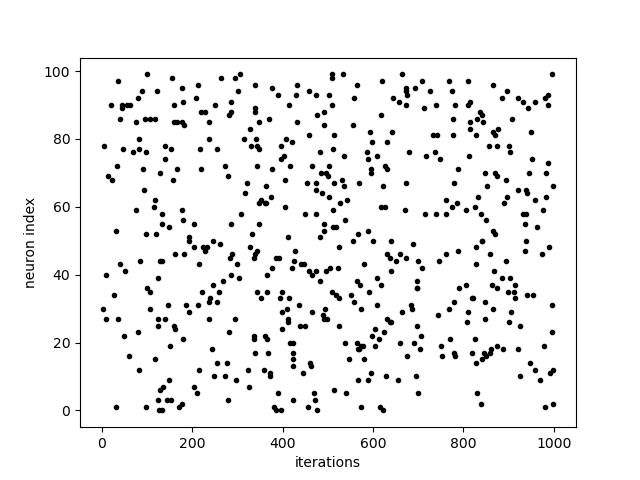
Here we also add an event recorder to plot the spikes of the NeuronGroup.
from PymoNNto import *
class Basic_Behavior(Behavior):
...
class Input_Behavior(Behavior):
def initialize(self, neurons):
for synapse in neurons.synapses(afferent, 'GLUTAMATE'):
synapse.W = synapse.matrix('uniform', density=0.1)
synapse.enabled = synapse.W > 0
def iteration(self, neurons):
for synapse in neurons.synapses(afferent, 'GLUTAMATE'):
neurons.voltage += synapse.W.dot(synapse.src.spike) / synapse.src.size * 10
My_Network = Network()
NeuronGroup(net=My_Network, tag='my_neurons', size=100, behavior={
1: Basic_Behavior(),
2: Input_Behavior(),
9: Recorder(['voltage', 'np.mean(voltage)'], tag='my_recorder'),
10: EventRecorder('spike', tag='my_event_recorder')
})
my_syn = SynapseGroup(net=My_Network, src=My_Neurons, dst=My_Neurons, tag='GLUTAMATE')
My_Network.initialize()
My_Network.simulate_iterations(1000)
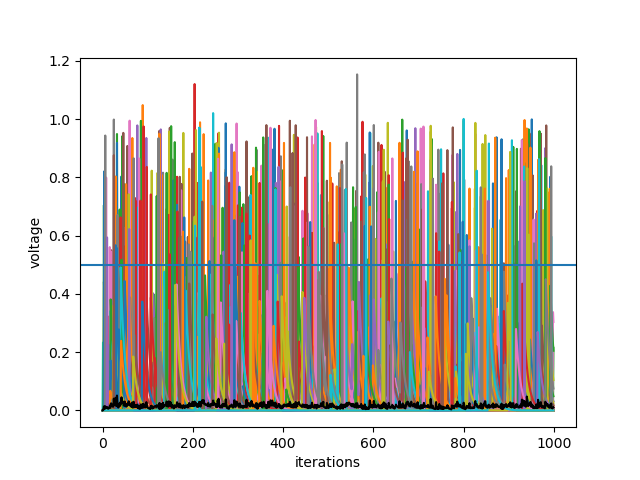
# plotting:
import matplotlib.pyplot as plt
plt.plot(My_Network['voltage', 0, 'np'][:, 0:10])
plt.plot(My_Network['np.mean(voltage)', 0], color='black')
plt.axhline(My_Neurons['Basic_Behavior', 0].threshold, color='black')
plt.xlabel('iterations')
plt.ylabel('voltage')
plt.show()
plt.plot(My_Network['spike.t', 0], My_Network['spike.i', 0], '.k')
plt.xlabel('iterations')
plt.ylabel('neuron index')
plt.show()