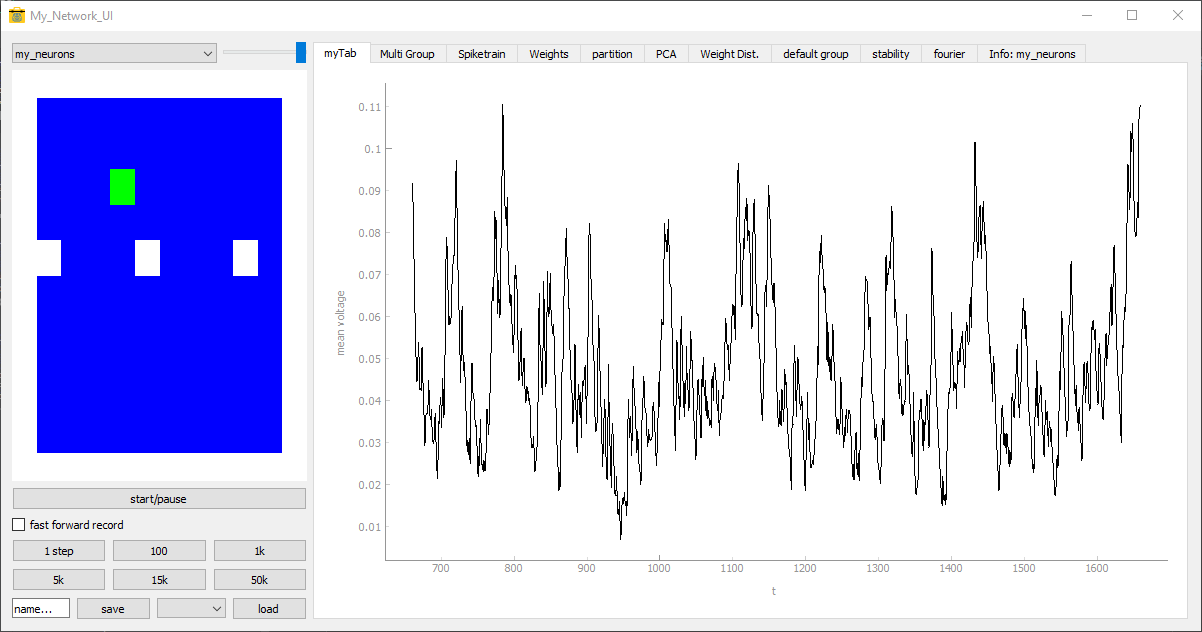
Custom UI Tab
In this last example we define a custom tab for the graphical user interface to plot the mean voltage of the neuron group (compatible with the basics tutorial). UI modules are derived from the TabBase class, which typically consists of the following four functions:
init()
add_recording_variables()
initialize()
update()
These modules have a similar layout as Behavior modules. The update function is called at every timestep. To access the parent user interface, we use an additional initialization function. Here, the init function is only defined to give the tab a name which can be done before the parent user interface is initialized.
We specify the tab and its user interface elements in the initialize function. First, we add a new tab by calling Network_UI.Next_Tab which creates a new tab element and a corresponding layout for the internal components. This layout is arranged in rows and we can attach Qt widgets (QLabel, QPushButton, QSlider, ...) to the current row with the Add_Element function. Next_H_Block can be called to jump to the next row. In this example we want to add a PyQtGraph plot to the tab, which is also a Qt widget compatible with the rest of the Qt framework. Because plotting is relatively common, there is a convenience function Add_plot_curve which creates a plot with a curve and adds them to the current row automatically.
Next, we define the recording variables in the add_recording_variables function. To this end, we call the Network_UI function add_recording_variable, specifying what we want to record and for how many time steps. This function checks whether there are redundant recorders and merges them. The access through the tagging system is not affected by this and is still the same like in the previous plotting example. Alternatively, one could directly add a recorder to the neuron group similar to the previous examples. However, this could be inefficient if multiple tabs use redundant or slightly similar recorders.
The last step is to define the update function which refreshes the plotted voltage trace. To save resources we check whether the tab is visible in the first place. If so, we access the recorded data via the tagging system. Like in the previous plotting example we can use the same string for variable evaluation and tagging. Therefore ['np.mean(n.voltage)', 0, 'np'] gives us the recorded mean of the voltage, selects the first and only element in the list of the tagged objects and directly converts it to a numpy array with the 'np' attribute. The [-1000:] at the end is optional and ensures that the plotted trace is not longer than 1000 elements, which could be the case when merging recorders of different length. This, however, only gives us the y-axis data. If we want to get the corresponding time steps on the x-axis, we can access the "iteration" trace in the same way as the y-data. This is possible, because the Network_UI adds this recorder automatically. To display the custom tab, we can add it to the list of ui_modules from the first examples, which is shown at the bottom of the code block.
# /Examples_Paper/Basic/Basic_Tab.py
from PymoNNto.Exploration.Network_UI.TabBase import *

class MyUITab(TabBase):

    def __init__(self, title='myTab'):
        super().__init__(title)

    def add_recorder_variables(self, net_obj, Network_UI):
        #if hasattr(net_obj, 'activity'):
        Network_UI.add_recording_variable(net_obj, 'np.mean(voltage)', timesteps=1000)

    def initialize(self, Network_UI):
        self.my_Tab = Network_UI.Next_Tab(self.title)
        self.my_curve = Network_UI.Add_plot_curve(x_label='t', y_label='mean voltage')

    def update(self, Network_UI):
        if self.my_Tab.isVisible():
            data = Network_UI.network['np.mean(voltage)', 0, 'np'][-1000:]
            iterations = Network_UI.network['iteration', 0, 'np'][-1000:]
            self.my_curve.setData(iterations, data)

        #...
#ui_modules = [MyUITab()] + get_default_UI_modules()
#Network_UI(my_network, modules=ui_modules, ...).show()