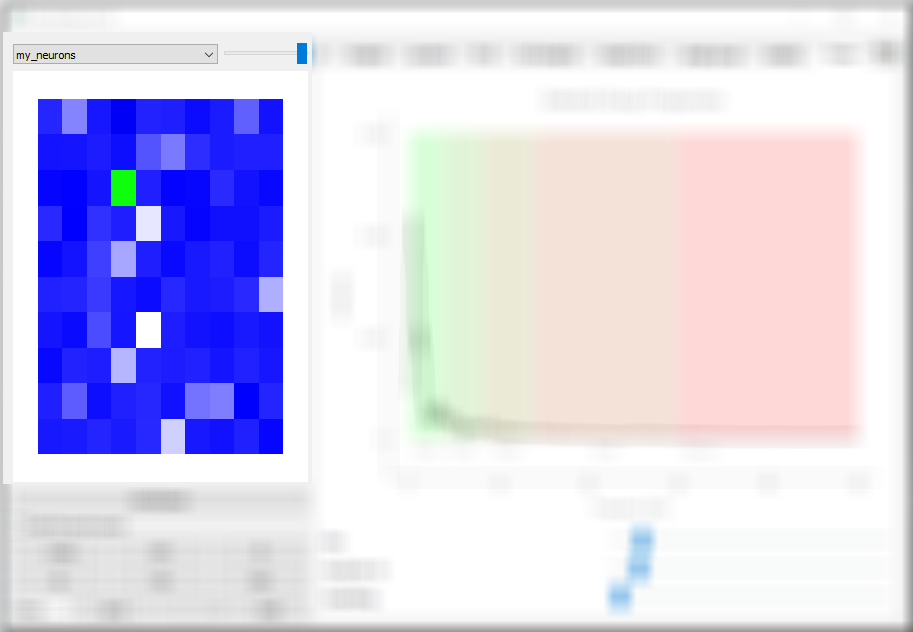
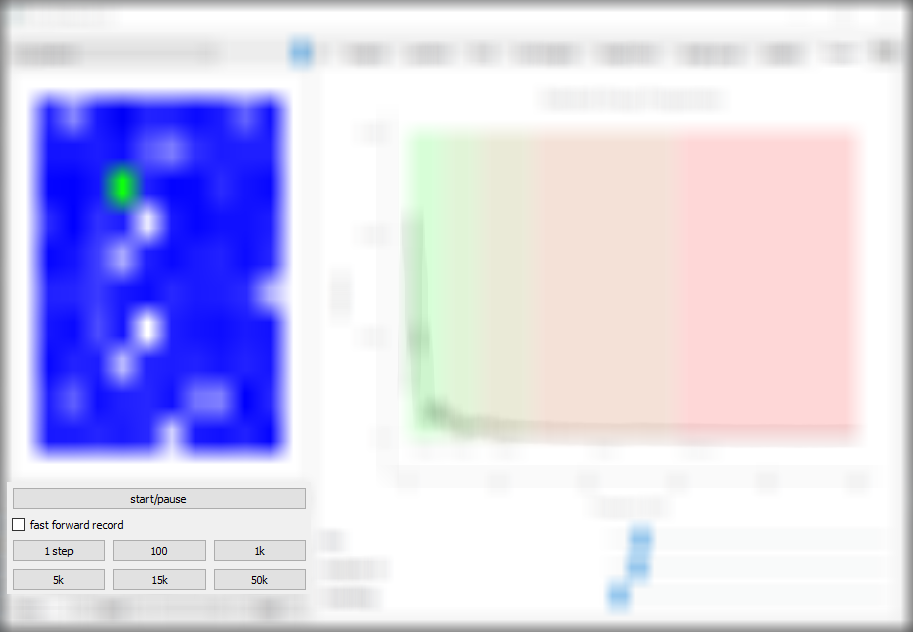
Sidebar Activity
The activity module can display neurons in a grid with different colors for different neuron variables. The variables and their colors can be definded with the dictionary given to the tab constructor. The base color is determined by the MyNeuronGroup.color value. The module is also required for different other modules because it can be used to select individual neurons which are then shown in green. The top drop down menu can be used to select different NeuronGroups and the slider to the right can be used to change different attributes of this selected group in other tabs.
UI_sidebar_activity_module(1, add_color_dict={'voltage':(255, 255, 255)})
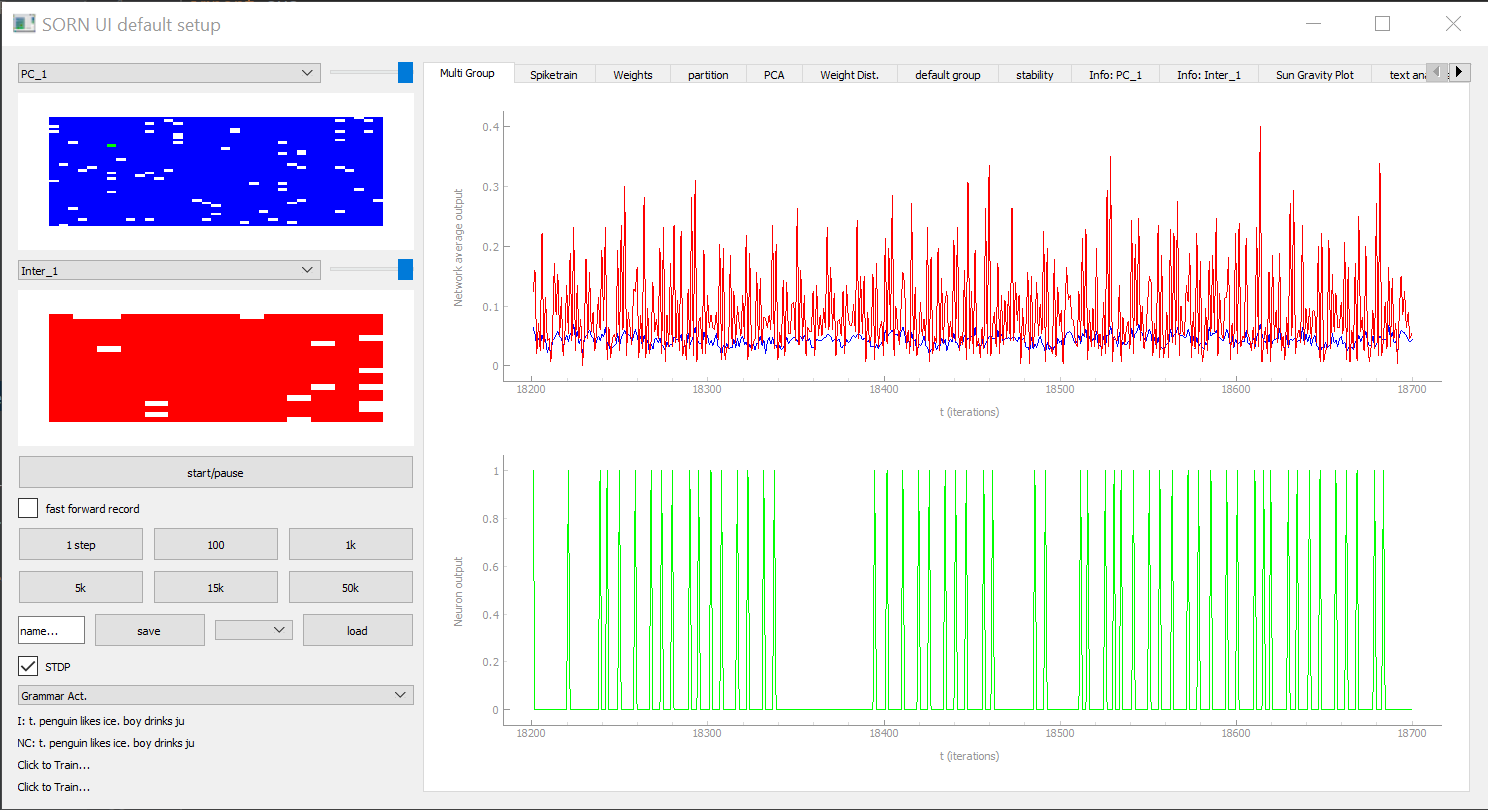
Multi Group Tab
The multi group tab can display the mean of some NeuronGroup variables and of individual neurons over time. Multiple Groups can can be displayed at the same time, so their variables, like their average activity can be compared. The sliders in the activity modules can be used to squeeze the graphs on top of each other which does only change the visualization. The list of NeuronGroup variables can be definded with the list passed to the constructor.
multi_group_plot_tab(['output'])
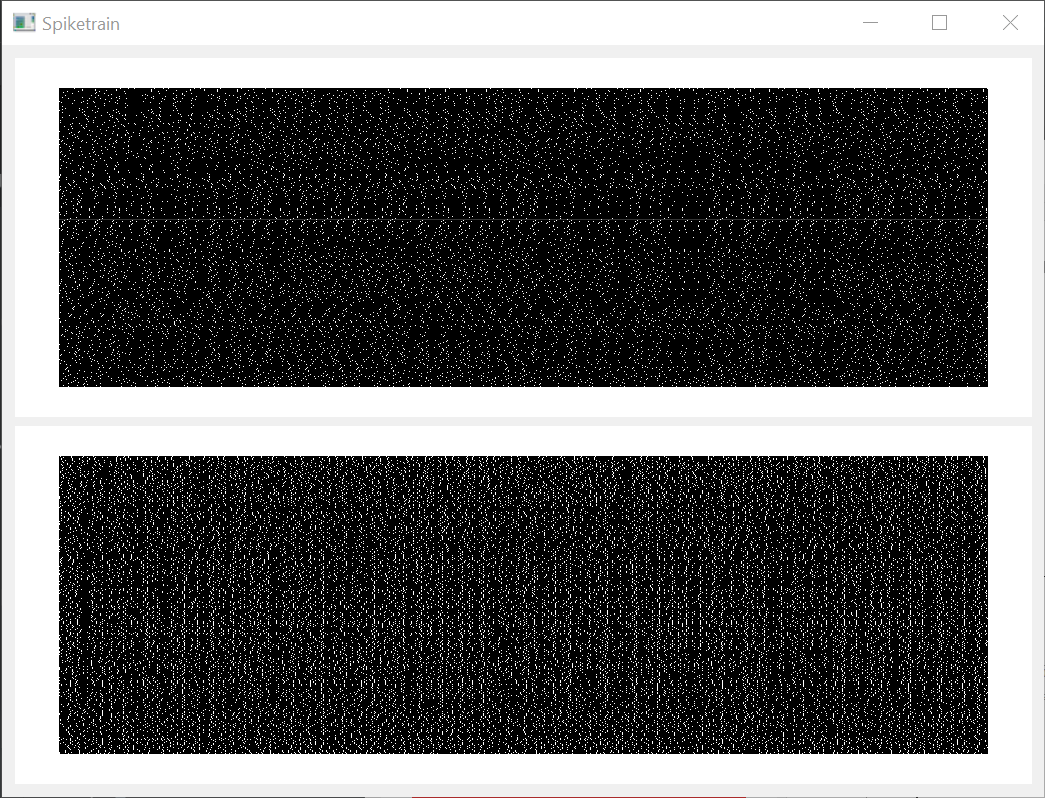
Spiketrain Tab
The spiketrain tab can be used to visualize a variable of all neurons of some NeuronGroups over time. On the x axis we can see individual timesteps while the y axis represents individual neuorns. The selected neuron is highlighted with a brighter bar.
spiketrain_tab(parameter='output')
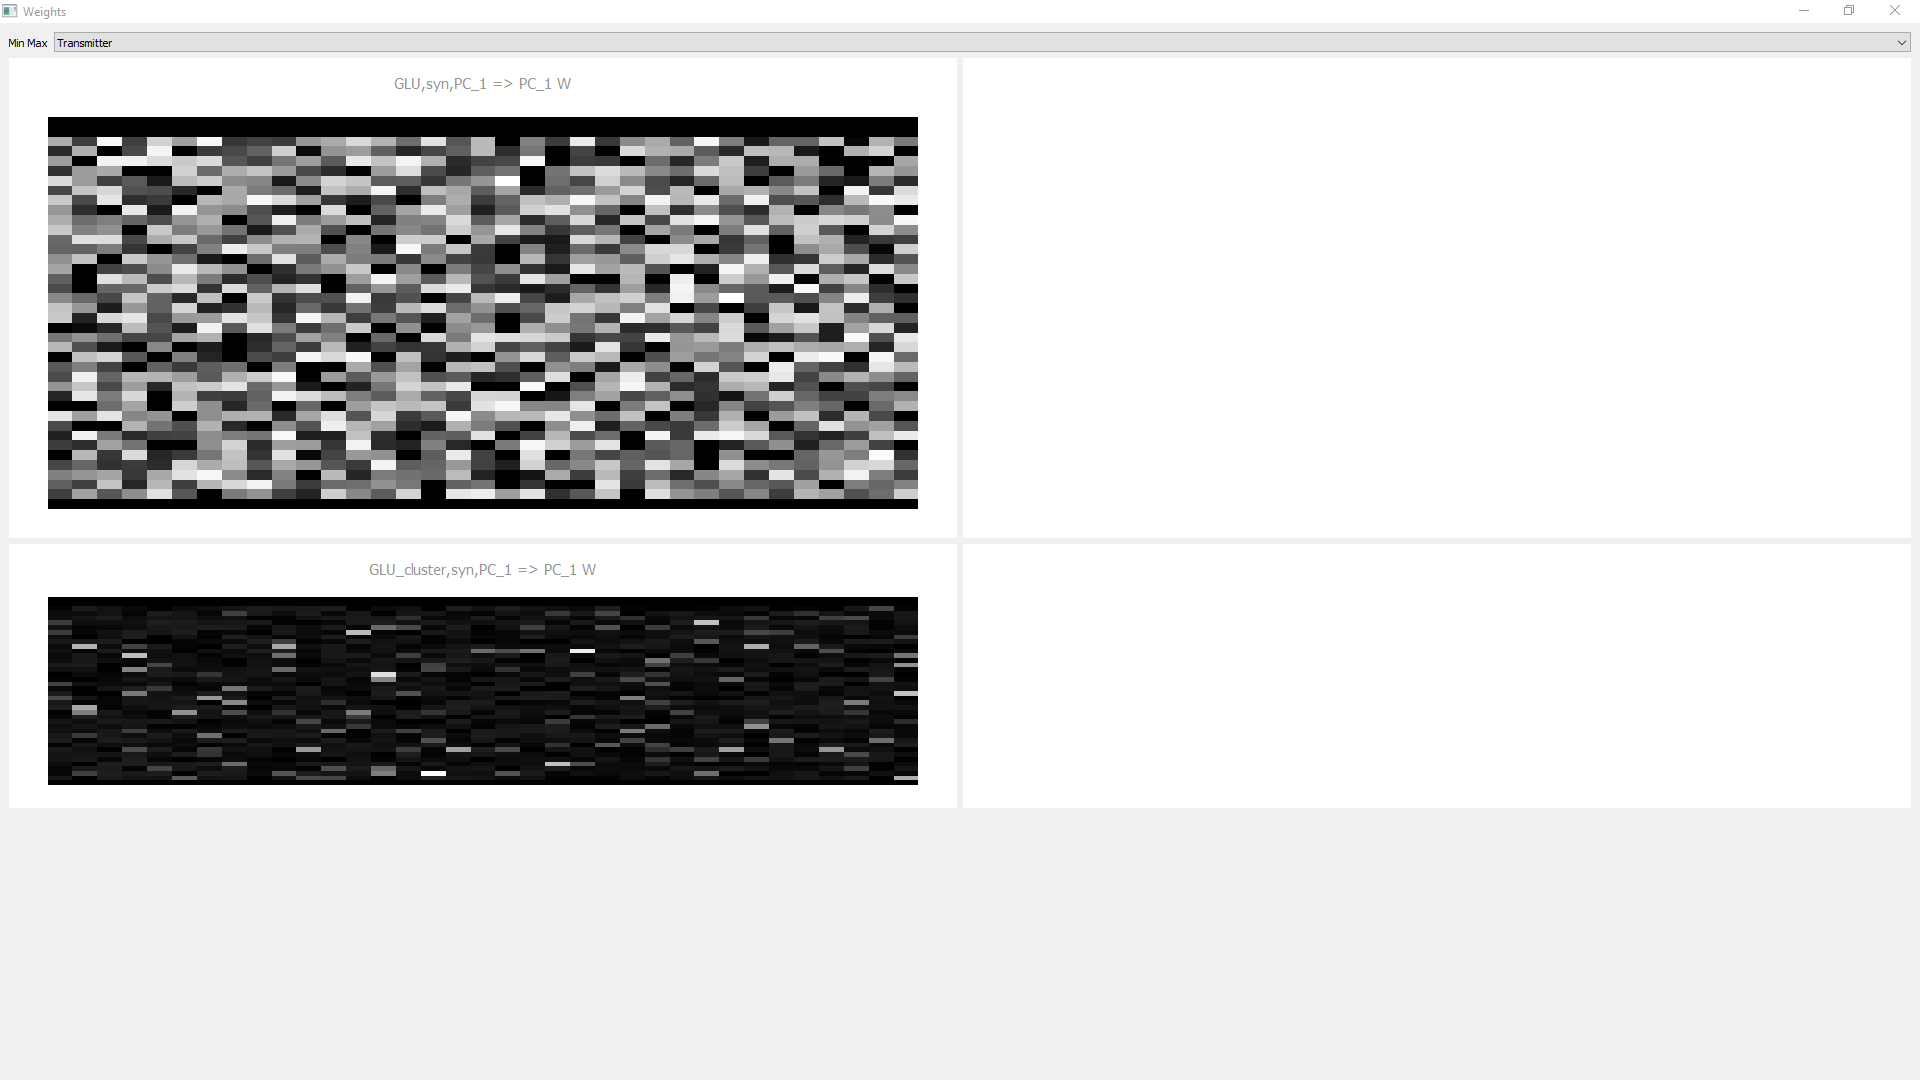
Weight Tab
The weight tab can visualize some variables of the the afferent synapses of the selected neuron. The SynapseGroup variables(matrix) can be defined in the constructor.
weight_tab(weight_attrs=['W'])
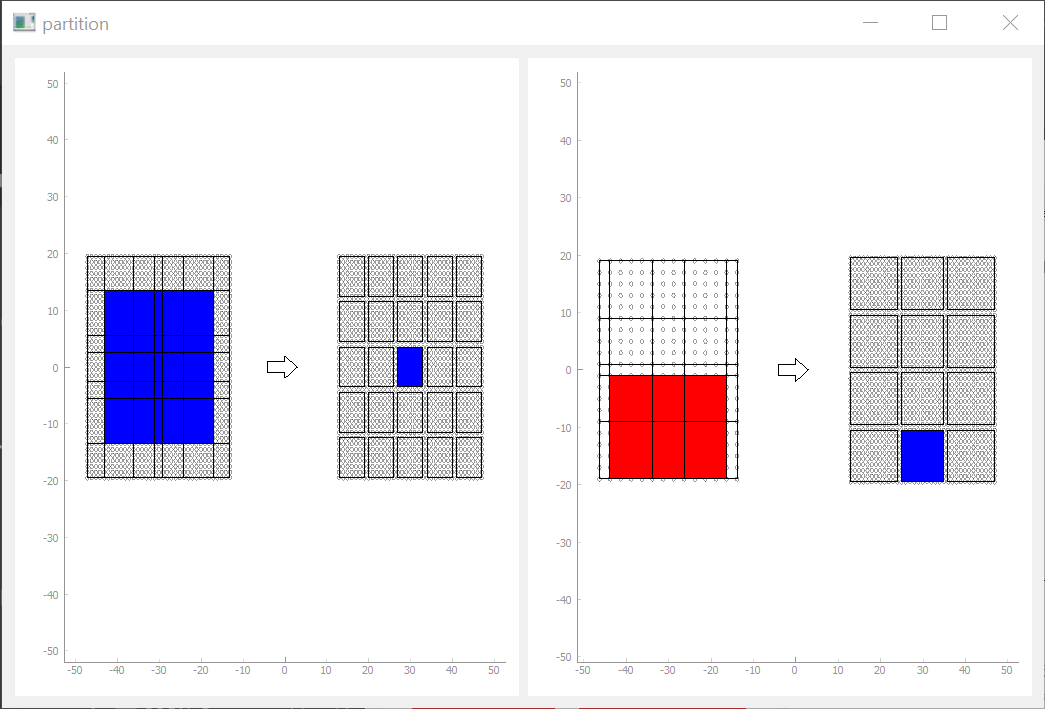
Partition_Tab
To speed up the processing of sparse synapse matrices, PymoNNto can split a NeuronGroup into subgroups when creating a new SynapseGroup. This can be useful when the neurons have receptive fields, for example. This partition tab can visualize a partitioned SynapseGroup. On the left of the arrow we always see the source neurons of the synapse and on the right the destination. We can interactively select some destination subgroups and see their maximum receptive field limited by the partition algorithm.
partition_tab()
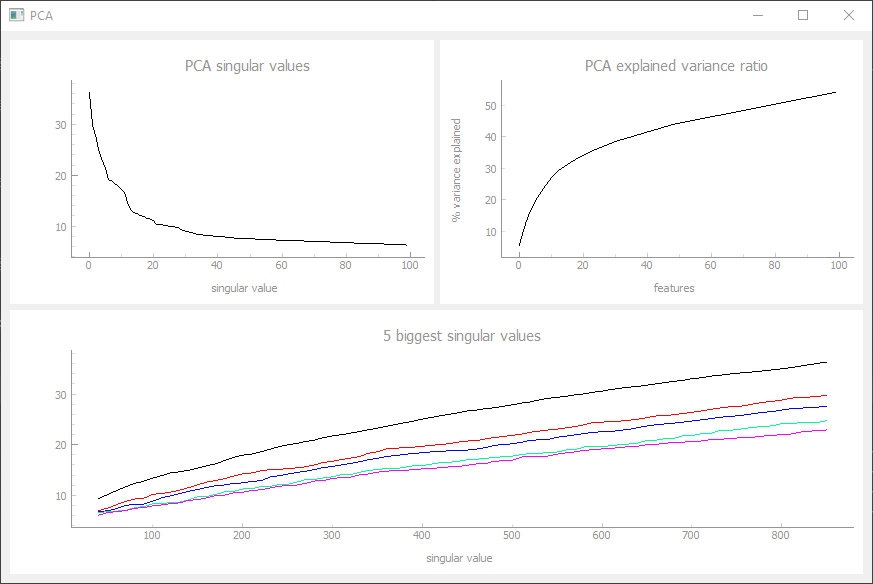
PCA Tab
The PCA Tab can display the singular values of some NeuronGroup vector recorded over the last timesteps (1000 by default). We see the current singular values (top left), the percentage explained by the biggest x features (top right) and the 5 biggest features over time.
PCA_tab(parameter='output')
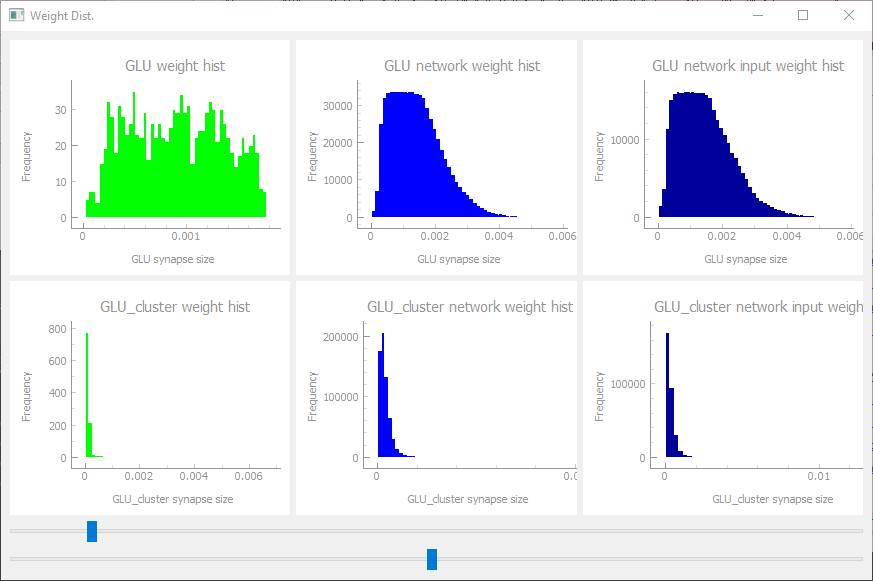
Weight Distribution Tab
The weight distribution tab can visualize histograms of the afferent weights of a NeuronGroup and its selected Neuron (green). The afferent Synapses are automatically sorted into rows for each transmitter type (first tag of the SynapseGroup). Multiple SynapseGroups with the same tag are combined and handeled like one big synapse matrix. The NeuronGroup can be subdivided into two groups with a mask_param vector which can be used to differentiate between neurons with and without external input, for example. With the sliders we can cut off very small synapses and change the number of bins of the visualized histograms. The synapse parameter (matrix) can be definded in the constructor.
hist_tab(weight_attr='W') #, mask_param='Input_Mask'
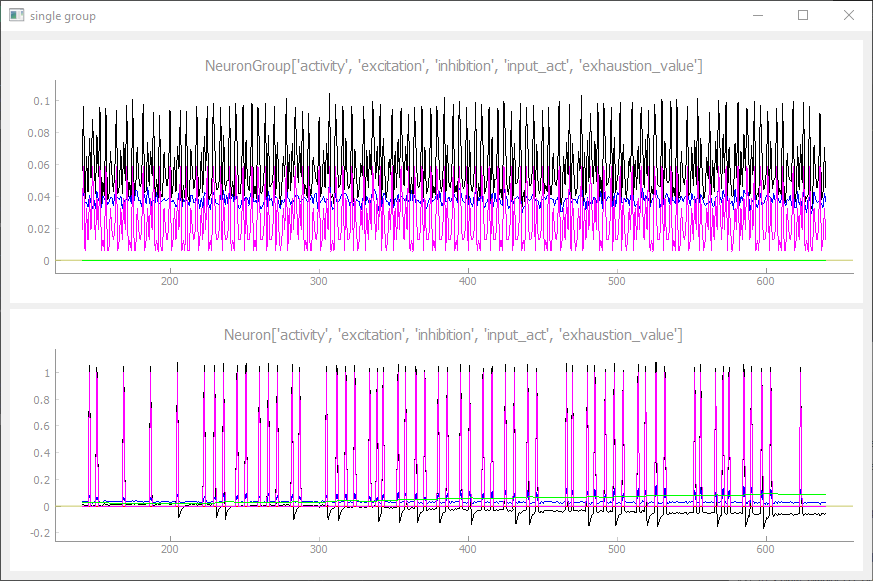
Single Group Tab
The single group plot tab can be used to visualize multiple variables within one NeuronGroup and in the selected neuron. All variables can be cosen in the constructor with an individual color and they are all visualized in one plot for a better comparison.
single_group_plot_tab({'output':(0, 0, 0), 'voltage':(0, 255, 0)})
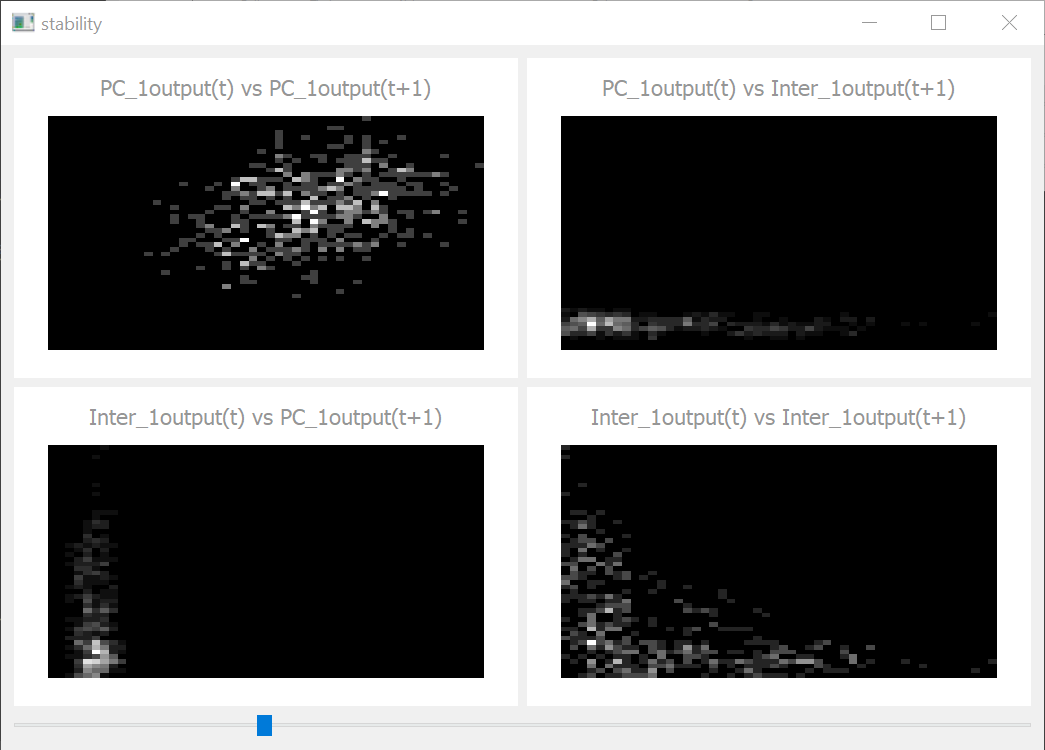
Stability Tab
The stability tab visualizes the autocorrelation of some variable in one and between different NeuronGroups. The x axis represents the value at timestep t and the y axis the next value at timestep t+1. When there are no oscillations in a Group, we should see a single dot. When the oscillations are very weak, we see a diagonal cloud from bottom left to the upper right corner while strong oscillations tend to create orthogonal clouds.
stability_tab(parameter='output')
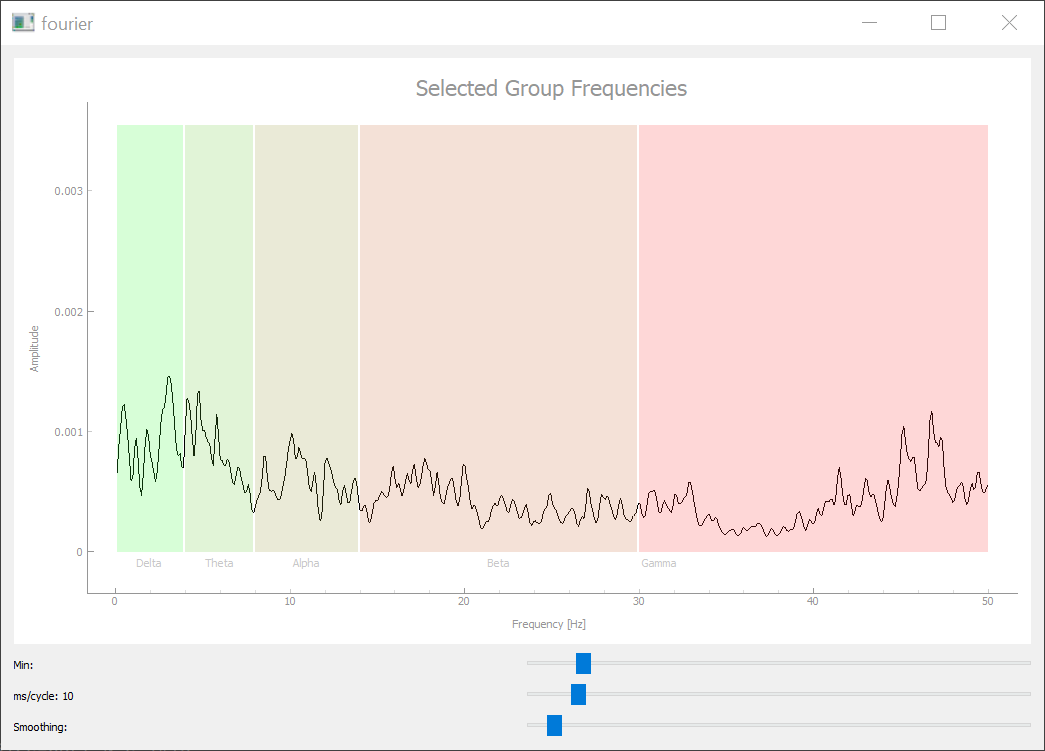
Fourier Tab
The fourier tab does a fourier transformation of the activity trace of the given variable. The x axis is divided into alpha, beta, gamma, ... bands. Because the simulation performs discrete timesteps without a "time" unit, we can select this unit with the slider below. The other sliders can cut off the lowest frequencies and smooth the plot to a certain degree.
fourier_tab(parameter='output')
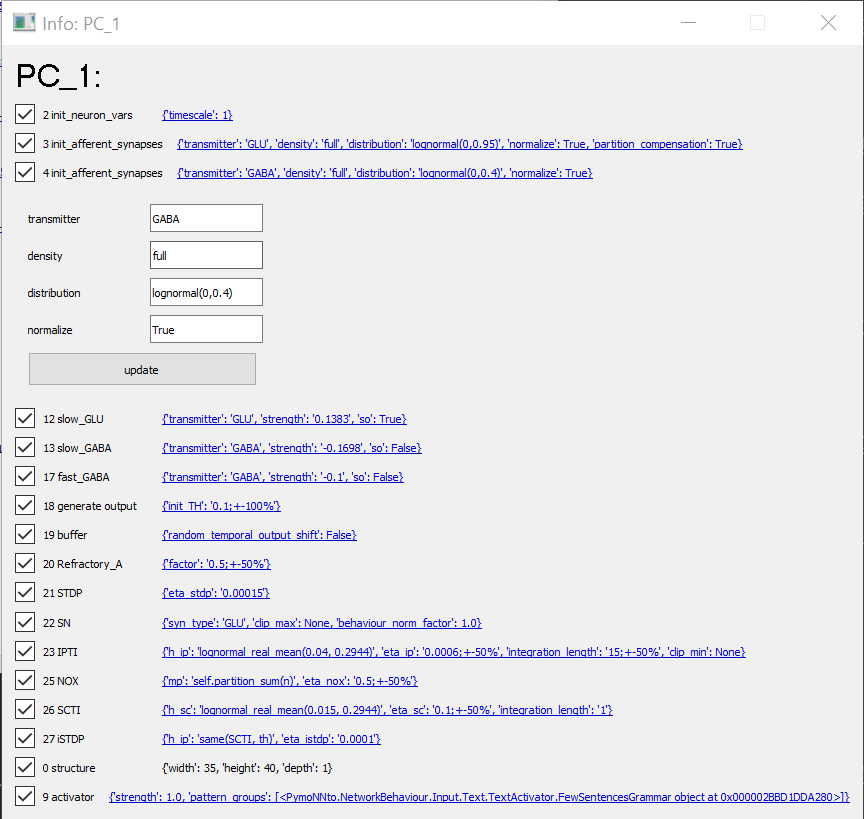
Info Tab
The info tab can monitor and change the NeuronGroup behavior attributes during the simulation. All attributes passed to the behavior during its construction can be seen and changed by clicking on the blue link-like text. This opens a drop down menu where we can change the individual attributes. When we click the update button we basically call the initialize function of the given behavior a second time, which should reset and re-initialize the given behavior. Note that only the initialize functions of the selected behaviors is updated, which can lead to problems, when different behaviors have to be initialized in a specific order.
info_tab()
Sidebar Fast Forward
The fast forward module can start, pause, and fast forward the simulation without ui updates. The checkbox defines whether the recorders are active during the this fast iterations.
sidebar_fast_forward_module()
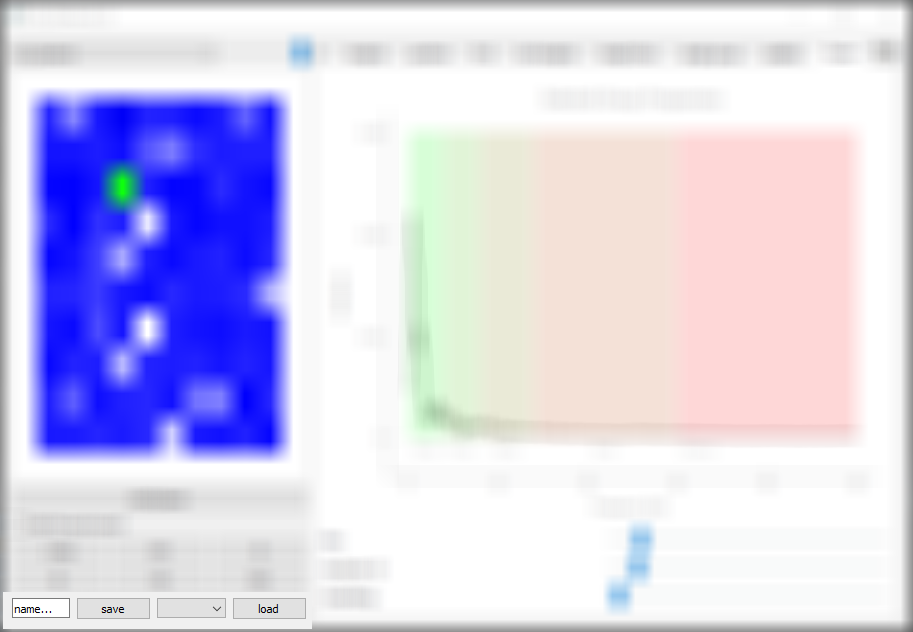
Sidebar Save Load
The save load module can be used to save and load individual network states. The filename can be defined in the textbox while the drop down menu displays states that are ready to load.
sidebar_save_load_module()