Text activation Tabs
Sidebar text input module
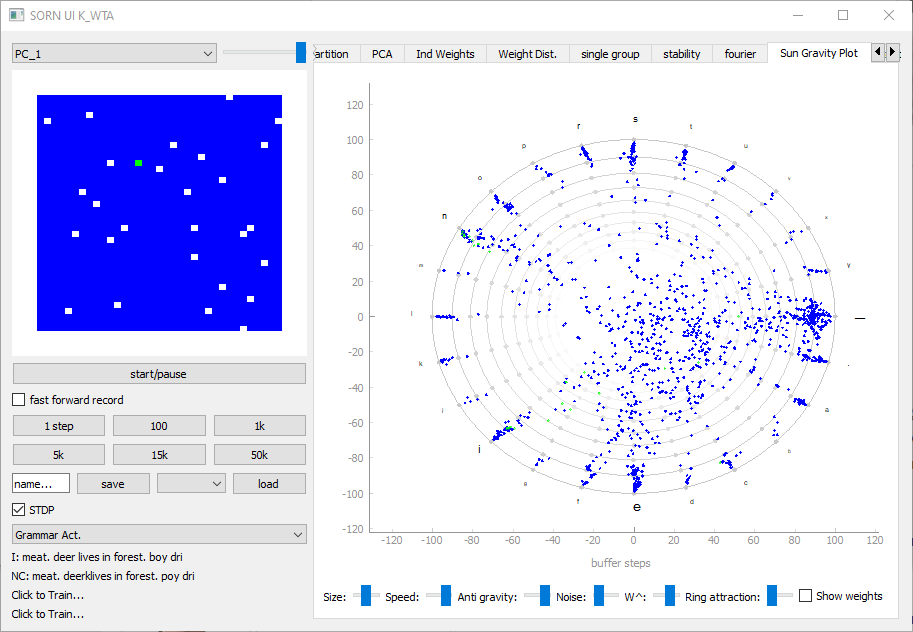
In the bottom left of the Sun gravity plot image we see the text input module. Here we can conveniently activate and deactivate STDP after the network has been trained and we see input currently fed into the network. The text in the next row displays the output of a reconstruction algorithm which selects the input with the highes number of primary input neurons connected to this pattern. When we click on the labels below, we can train a supervised classifier which can also be used to reconstruct the current network state. The classifier output can also be seen here after trianing. With the drop down menu we can select the current input activator or deactivate it.
Sun Gravity Plot Tab
This tab can be used for text learning analysis. Here each blue dots correspond to neurons of the NeuronGroup that attract each other based on their synaptic connections. The input neurons which are activated by individual character are fixed to the outer ring. The spacial position of the dots can tell us which representation the neuron has learned.
The attraction of each neuron differs from normal gravity where two masses are pulled together. When we have a neuron on a ring, it pulls its target neurons one to the closest position one ring further to the center.
By this, we avoid blobs of neurons and this visualization also alows us to see chains of neurons more clearly.
The sliders can controll the size of the neurons, their movement speed and noise, as well as more complex mechanisms.
Anti gravity makes the attraction of the neurons stronger, the further away they are from the center. By this we can avoid a giant blob in the center, when the synapses are relatively dense or similar to each other.
The W^ option adds some exponent to the weight attributes before they are normalized and plotted. By this, the weight matrix gets more extreme, which leads to clearer differentiations when the synapses are relatively similar.
Ring attraction adds another force to the neuron particles. the further the slider is to the right, the more each neuron is attracted to its closest ring, which makes the picture less messy. Note that neurons are stuck to the ring when the force is to strong.
We can also click on the dots to select different neurons and show their strongest afferent connections with the checkbock.
The plot can visualize multiple NeuronGroups at once.
Reconstruction Tab

Char activation Tab
