OpenGL Tab Example
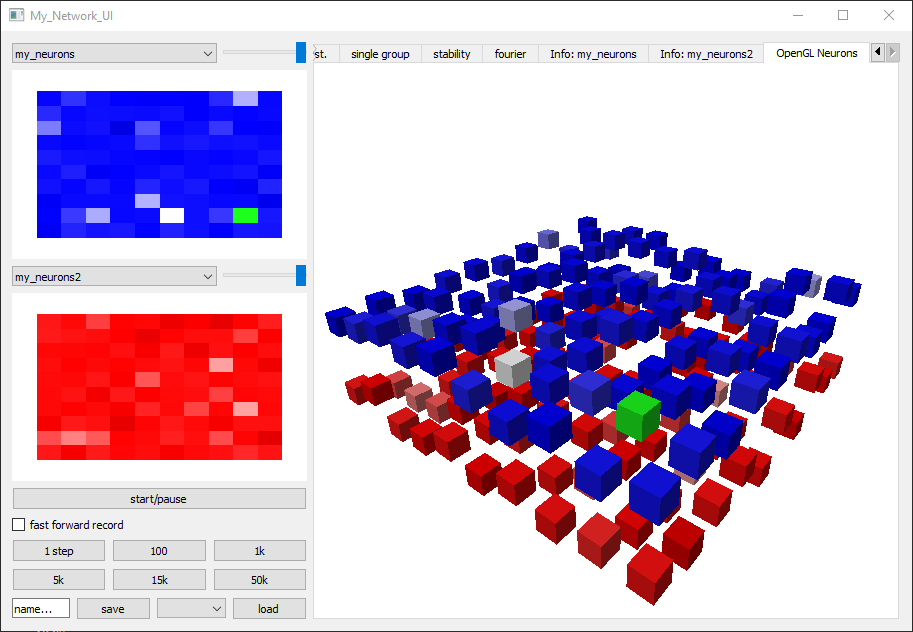
PyQt and the pyplot modules can also be used to render 3D content with OpenGL. Here we see the source code of a simple tab, which displays the neuron grids on the left with some noise for the vertical position. The code creates a GLViewWidget with multiple GLBarGraphItems for each neuron. the color is then updated with bar.setColor()
# /Examples_UI/OpenGLTab.py
from PymoNNto.Exploration.Network_UI.TabBase import *
import pyqtgraph.opengl as gl

class OpenGLTab(TabBase):

    def __init__(self, variable='voltage', title='OpenGL Neurons'):
        super().__init__(title)
        self.variable = variable

    def add_recorder_variables(self, net_obj, Network_UI):
        return

    def initialize(self, Network_UI):
        self.my_Tab = Network_UI.Next_Tab(self.title)

        self.glvw = gl.GLViewWidget()
        self.glvw.setBackgroundColor((255.0, 255.0, 255.0, 255.0))
        #self.glvw.setAutoFillBackground(True)

        #pg.setConfigOption('background', 'w')
        #pg.setConfigOption('foreground', 'k')

        #n = Network_UI.selected_neuron_group()

        for n in Network_UI.network.NeuronGroups:
            n.bars = []

            for i in range(n.size):
                pos = np.array([[[n.y[i]-0.25, n.x[i]-0.25, n.z[i]-0.25]]])
                size = np.array([.5, .5, .5])

                bg = gl.GLBarGraphItem(pos, size)
                bg.setColor((.5, 1., .5, .5))

                #bg.setGLOptions('translucent')

                self.glvw.addItem(bg)
                n.bars.append(bg)

        #Xdot = (0, 0, 0)
        #Ydot = (100, 100, 100)
        #pts = np.array([Xdot, Ydot])
        #line = gl.GLLinePlotItem(pos=pts, width=1, antialias=True)
        #bg.setColor((1., 1., 1., 1.))
        #self.glvw.addItem(line)

        Network_UI.Add_element(self.glvw)

    def update(self, Network_UI):
        if self.my_Tab.isVisible():
            for n in Network_UI.network.NeuronGroups:
                #n = Network_UI.selected_neuron_group()
                attr = eval('n.'+self.variable)
                for i in range(n.size):
                    c = np.array(n.color).astype(np.float64)/255.0
                    if n == Network_UI.selected_neuron_group() and i==Network_UI.selected_neuron_id():
                        c = [0.0, 1.0, 0.0, .5]
                    c += attr[i]
                    c = np.clip(c, 0, 1)
                    n.bars[i].setColor(c)

#from PymoNNto.Exploration.Network_UI.Advanced_Tabs.OpenGLTab import *
#+ [OpenGLTab()]